A taste of ethanol
February, 2023 | Christian D. Nell | christian@isolvents.co.za
Research consultant, BSc Molecular Biology and Biotechnology, Stellenbosch University
A history of fermenting sugar-rich plants for making alcoholic drinks can be traced back in many cultures over the world. Today, many kinds of alcoholic beverages have varying alcohol concentrations with unique flavour profiles and are available to purchase globally. To take a broad stroke at the widely known drinks such as beer, wine, cider, and spirits – they are commonly consumed in most countries – and sometimes modified with flavours akin to the local culture. One should wonder how it is that alcohol (a liquid found in nature) has the potential to preserve, combine and release flavour types ranging from herbaceous flora to zesty fruits, and even sweets like marshmallow!
The primary carrier of flavour in alcoholic drinks is ethanol – the basic molecule in any liquor or fermented beverage. It has a simple two-carbon structure that interacts with water to bring out flavour compounds in the liquid mixture. This makes ethanol the defining component of alcoholic beverages, in terms of both physiochemical effects on the mixture and the impact it has on flavour release and sensory experience. For this reason, any person or company that is interested in manufacturing alcoholic beverages should take note of how the ethanol concentration in a drink is modifying its taste. Giving them the option to adjust the level of concentration by adding pure ethanol.
Physiochemical effects of ethanol in alcoholic drinks
The primary way that ethanol changes the flavour of a beverage is through its effect on the chemical composition of a liquid mixture. At any concentration, ethanol interacts with water, altering the intensity and diversity of flavour. This occurs because flavour compounds in water bind with receptor molecules in our mouths and throats, with ethanol acting as a vehicle for these compounds as they spread across the palate.
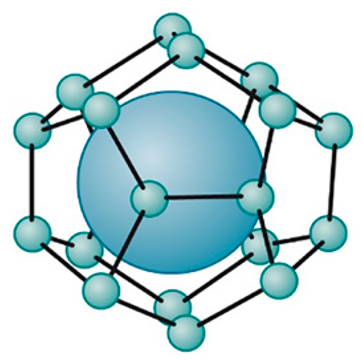
 Figure 1: A molecular model of a clathrate cage
The interaction between water and ethanol is described by the water-ethanol matrix, which changes significantly as solutions transition from pure water to pure ethanol. Below 15% ethanol concentration, each ethanol molecule is surrounded by water molecules, forming a structure known as a "clathrate cage." This structure allows ethanol to expose more aromatic compounds present in the water to the surfaces in the mouth. This explains why secondary flavours, perceived as ethanolic flavours, are released more potently at low concentrations of ethanol, as they are carried along by ethanol in the mouth-space.
Above 15% ethanol concentration, ethanol molecules clump together to form structures called "micelles," where every water molecule has bonded to an ethanol molecule. At this concentration, there is a distinct sharpness to the flavour of the drink, as many of these micelles do not carry any secondary flavour compounds. In such instances, the surfaces of your mouth interact only with ethanol, tasting it in its pure form.
Another change in the ethanol-water matrix occurs at 57% ethanol concentration. At this concentration, the water molecules no longer bind to each other, and ethanol carries even fewer secondary flavours present in the solution. Most people will say that at this point, the ethanol has overpowered any flavour in the beverage, describing the taste as either only bitter or only sour.
 Figure 2: Ethanol and sucrose sweetness
What Does Ethanol Taste Like?
Knowing that aromatic flavours are best carried by a beverage below 15% ethanol concentration, dryer alcoholic beverages become more ethanolic between ethanol concentrations of 15%-57%. This ethanolic flavour is described in some cases to be distinctly sweet. However, it is proven that evaporating ethanol from an alcohol gives it stronger fruity aroma, affecting the perception of taste to be sweeter and subtler on the palate. So, on one hand ethanol tastes sweetest above 15% concentration, but standard practice proves that beverages are sweeter at low concentrations of ethanol. This conflicting data has called scientists to understand whether ethanol has an intrinsic sweet taste to it – and if not, to find clarity on what its inherent flavour is.
The best way to understand what ethanol tastes like, is to recognise it as a flavour intensifier – either bringing out secondary flavours in a drink or increasing the potency of its own taste. Intensity of ethanol taste has a significant positive correlation with sweetness on account of sucrose concentration. The intensity of ethanol taste is highest between 10% and 30% ethanol, even with very low sucrose concentrations of 1%. This suggests that any additional sweetness in an alcoholic beverage increases the perceived ethanolic taste – proving that ethanol is predominantly sweet on its own. This shows that there is no chemical interaction between ethanol and sucrose that increases the sweetness of a drink, but each of them adds sweetness to a beverage on its own.
So there is sweetness intrinsic to a drink on account of the sucrose concentration, and a sweetness to a drink on account of the inherent flavour of ethanol. And some findings show that ethanol activates nerve fibres in the mouth and oesophagus that are sensitive to low sugar concentrations. When these fibres are excited by the effects of ethanol, they may be too weak to induce taste descriptors of sweetness from sucrose, but strong enough to increase intensity of ethanol taste.

Ethanolic flavour supplementation of non-alcoholic drinks
We've discussed how high levels of ethanol concentration effect alcoholic beverages, and how intermediate levels of ethanol concentration effects the sweetness of a drink. Now we turn to ethanol use in non-alcoholic drinks. According to the Turkish University Journal of Health Sciences, non-alcoholic beverages are defined as drinks containing less than 0.3% ethanol by volume. At this concentration ethanol can still excite nerve fibres in the mouth to increase the intensity of flavours in the mouth.
Companies such as Fruit Fusion use ethanol to amplify the flavour and to ensure that the flavours are water soluble in application. These flavours are used in yoghurts, ice-cream, iced tea, fruit juices, confectionaries and various other beverages. Ethanol is the ideal natural solvent to use for extraction of fruitiness from juices. At iSolvents we want to partner with the beverage industry to make the best quality products. We supply pure food-grade ethanol, ready for use for flavour extraction and modification. Order your ethanol now with the best service and shortest leading time in the market.
References
- Cretin, B. N., Dubourdieu, D., & Marchal, A. (2018). Influence of ethanol content on sweetness and bitterness perception in dry wines. LWT - Food Science and Technology, 87, 61–66.
- Scinska, A., Koros, E., Habrat, B., Kukwa, A., Kostowski, W., & Bienkowski, P. (2000). Bitter and sweet components of ethanol taste in humans. Drug and Alcohol Dependence, 60(2), 199–206.
- Turkucar, S.A., Dolu, O.F., Alveci, A., Burnaz, N.A., Karacelik, A.A., Dogan, H., Polat, D., Kucuk, M. (2017). Ethanol levels of the non-alcoholic beverages sold in markets in Turkey. Gumushane University Journal of Health Sciences, 6(1):121-128.